Recommendation Types Used
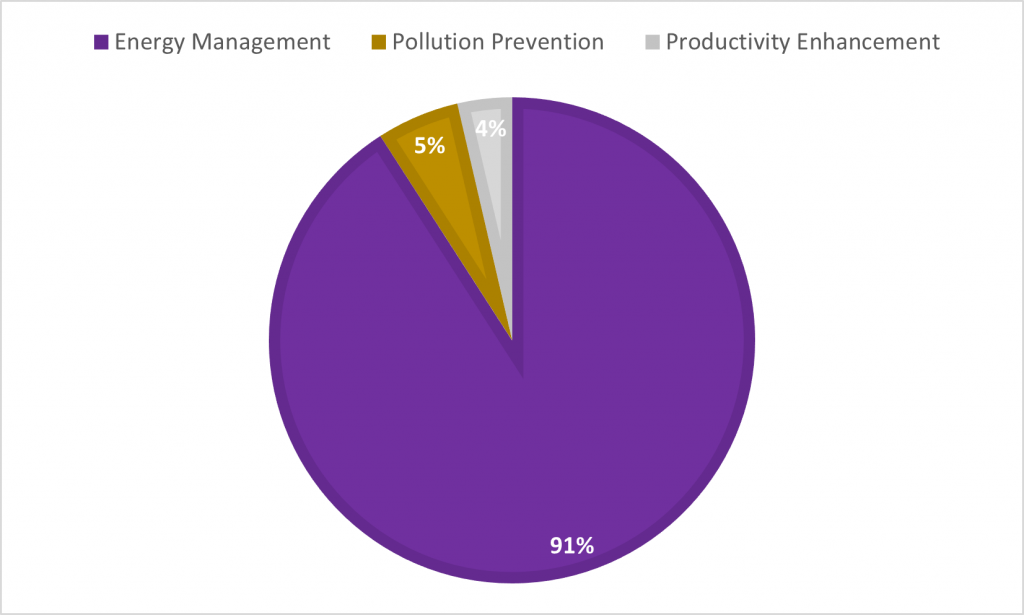
AR Codes – V21.1
LSU Recommendations
Topic 2: Energy Management
Percent of Topic 2 Recommendation come from the following areas:
2.1 – Combustion Systems (1.9%)
2.2 – Thermal System (7.5%)
2.3 – Electrical Power (2.1%)
2.4 – Motor Systems (36.3%)
2.5 – Industrial Design (0%)
2.6 – Operations (4.4%)
2.7 – Building and Grounds (44.2%)
2.8 – Ancillary Cost (1.9%) 2.9 – Alternative Energy Use (1.7%)
Recommended Savings
77,208,323 kWh
$6,192,244 in energy
Topic 3: Waste Minimization
Percent of Topic 3 Recommendation come from the following areas:
Typically recommendations have an average payback of 1 year!
3.1 – Operations (9.7%)
3.2 – Equipment (3.2%)
3.3 – Post Generation Treatment
(3.2%)
3.4 – Water Usage (3.2%)
3.5 – Recycling (6.5%)
3.6 –Waste Disposal (3.2%)
3.7 – Maintenance (67.7%)
3.8 – Raw Materials (3.2%)
Topic 4: Direct Productivity Enhancement
Percent of Topic 4 Recommendation come from the following areas:
4.1 – Manufacturing Enhancements (19.0%)
4.2 – Purchasing (0%)
4.3 – Inventory (9.5%)
4.4 – Labor Optimization (38.1%)
4.5 – Space Utilization (4.8%)
4.6 – Reduction of Downtime (23.8%)
4.7 – Management Practices (0%) 4.8 – Other Administrative Settings (4.8%)
Recommended Savings:
$1,812,689 in cost
(in areas of automation, IIOT sensors, floor layout, and building demolition!)